

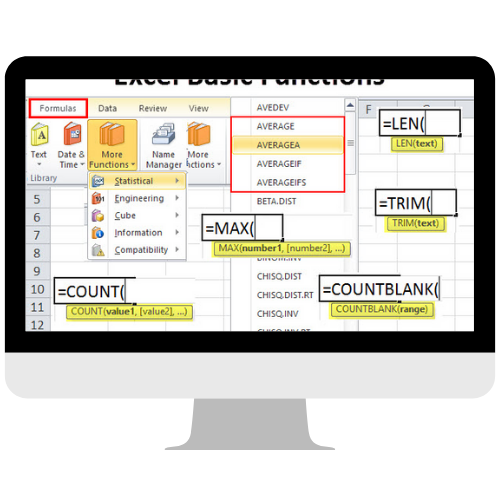
Excel Basics and Advanced Training
MS Excel is a spreadsheet program, developed by Microsoft with dozens of tools for calculations, equations, grids of text and graphs. Learning Excel is immensely useful if you’re a part of the business/corporate world. We provide trainings for both levels of learning Excel: basics and advanced. Basics trainings will make you fluent in making Worksheets using Excel features such as Cell Merging, Formatting, Data Validation, Pivot Charts, Freeze Pane, formulas and so on. While Advance Excel training will make you fluent in playing with Big Data using the help of Power Pivot, Power Query, Developer, Macros and so on. Learning Excel can open doors to many opportunities and adds one more ability to your skill set.
Excel Dashboard Reporting
A Dashboard reporting is a tool used in Excel to track and analyze the health of a business by reporting on business metrics, analytics, comparison and trends etc. The main purpose of this feature is to help managers and business leaders to make a critical decision using key KPI’s and metrics. Our company provides training for this handy software skill, not only is it beneficial to yourself but to your organization as well since it is technically a health monitor for your business; analysis and reporting act as a foundation for future decisions.
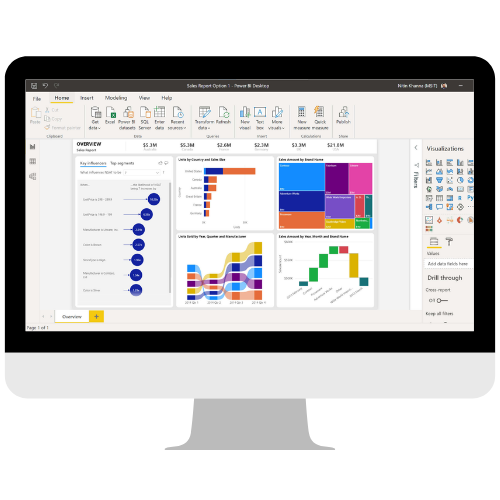
Power BI Reporting
A Power BI report is a multi-perspective database, used to bridge the gap between data and decision making, it provides one or more visuals of findings and insights from a dataset in a report. We give training for power BI reporting, and this is especially handy for those who prefer to use visuals to express data rather than text and figures;